
Plotting a weighted graph using networkx
Updated:
In this blog post, I show how to plot a weighted graph using networkx.
The following code makes a graph based on a list of nodes and a matrix of edge weights.
For this example, I used the following code the generate the graph and plot the matrix:
1
2
3
4
5
6
7
8
9
10
>>> n_nodes = 4
>>> M = np.random.rand(n_nodes, n_nodes)
>>> print(M)
[[0.91753808 0.3683666 0.3096244 0.19456242]
[0.41662811 0.88492788 0.85076841 0.40816722]
[0.821422 0.25108361 0.25305956 0.88238645]
[0.48321248 0.73035534 0.25434072 0.50384568]]
>>> nodes = range(M.shape[0])
>>> G = make_graph(nodes, M)
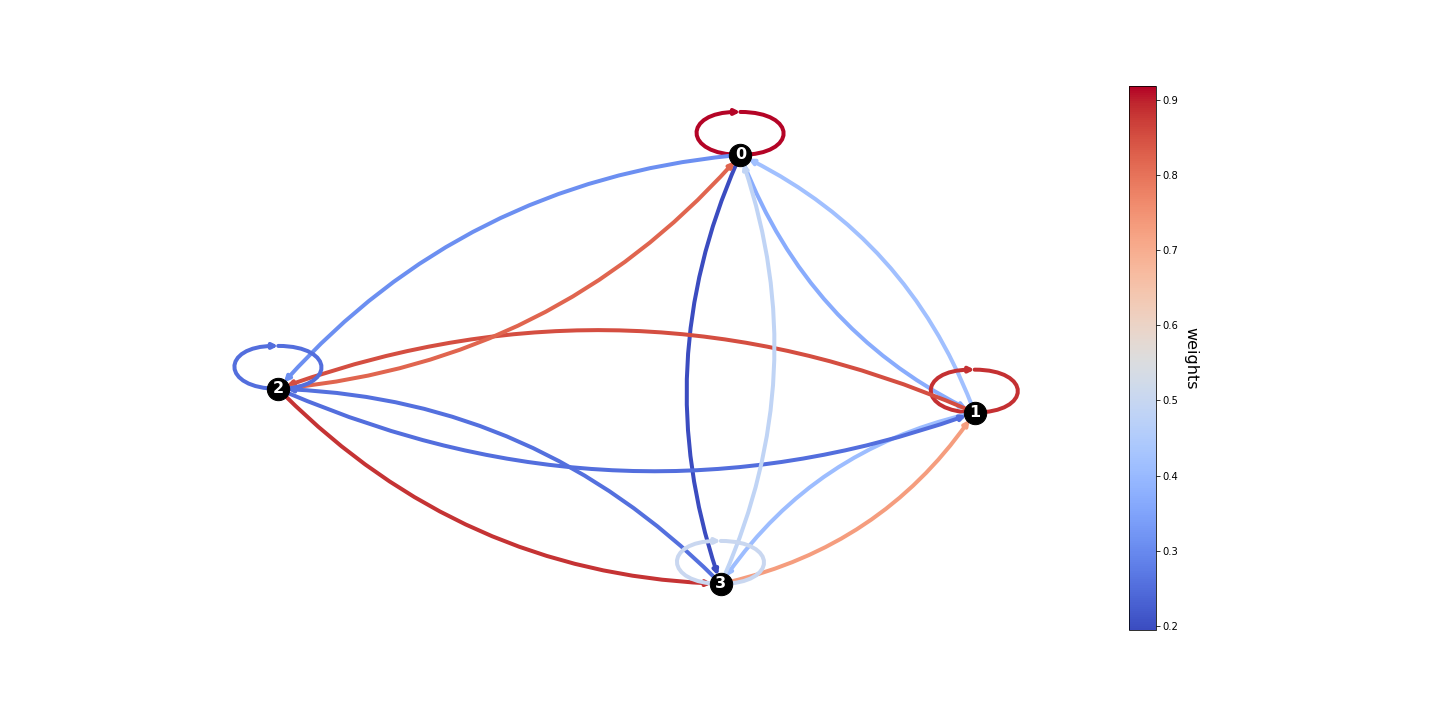
>>> graphplot(G, M)
The obtained graph is shown below, the weights are encoded as colors of the edges.
Comments